Guides
Physical Therapy Scheduling Metrics Every Owner Should Track Monthly
Track physical therapy scheduling metrics monthly: utilization, cancellations, no-shows and revenue per visit, plus a seasonal and yearly routine.
What to take away
- Track four numbers monthly: therapist utilization, cancellation rate, no-show rate and revenue per visit in USD.
- Compare utilization and cancellation against your own payer mix, not a national average, because Medicare, Medicaid and commercial contracts differ sharply.
- The first thing to fail from neglect is the reminder and confirmation step; no-shows and late cancellations climb before anything else moves.
- Rebuild the metric set once a year, and revisit the software contract every few years.
- A single month of rising no-shows is noise; two consecutive months is a scheduling leak.
The monthly dashboard
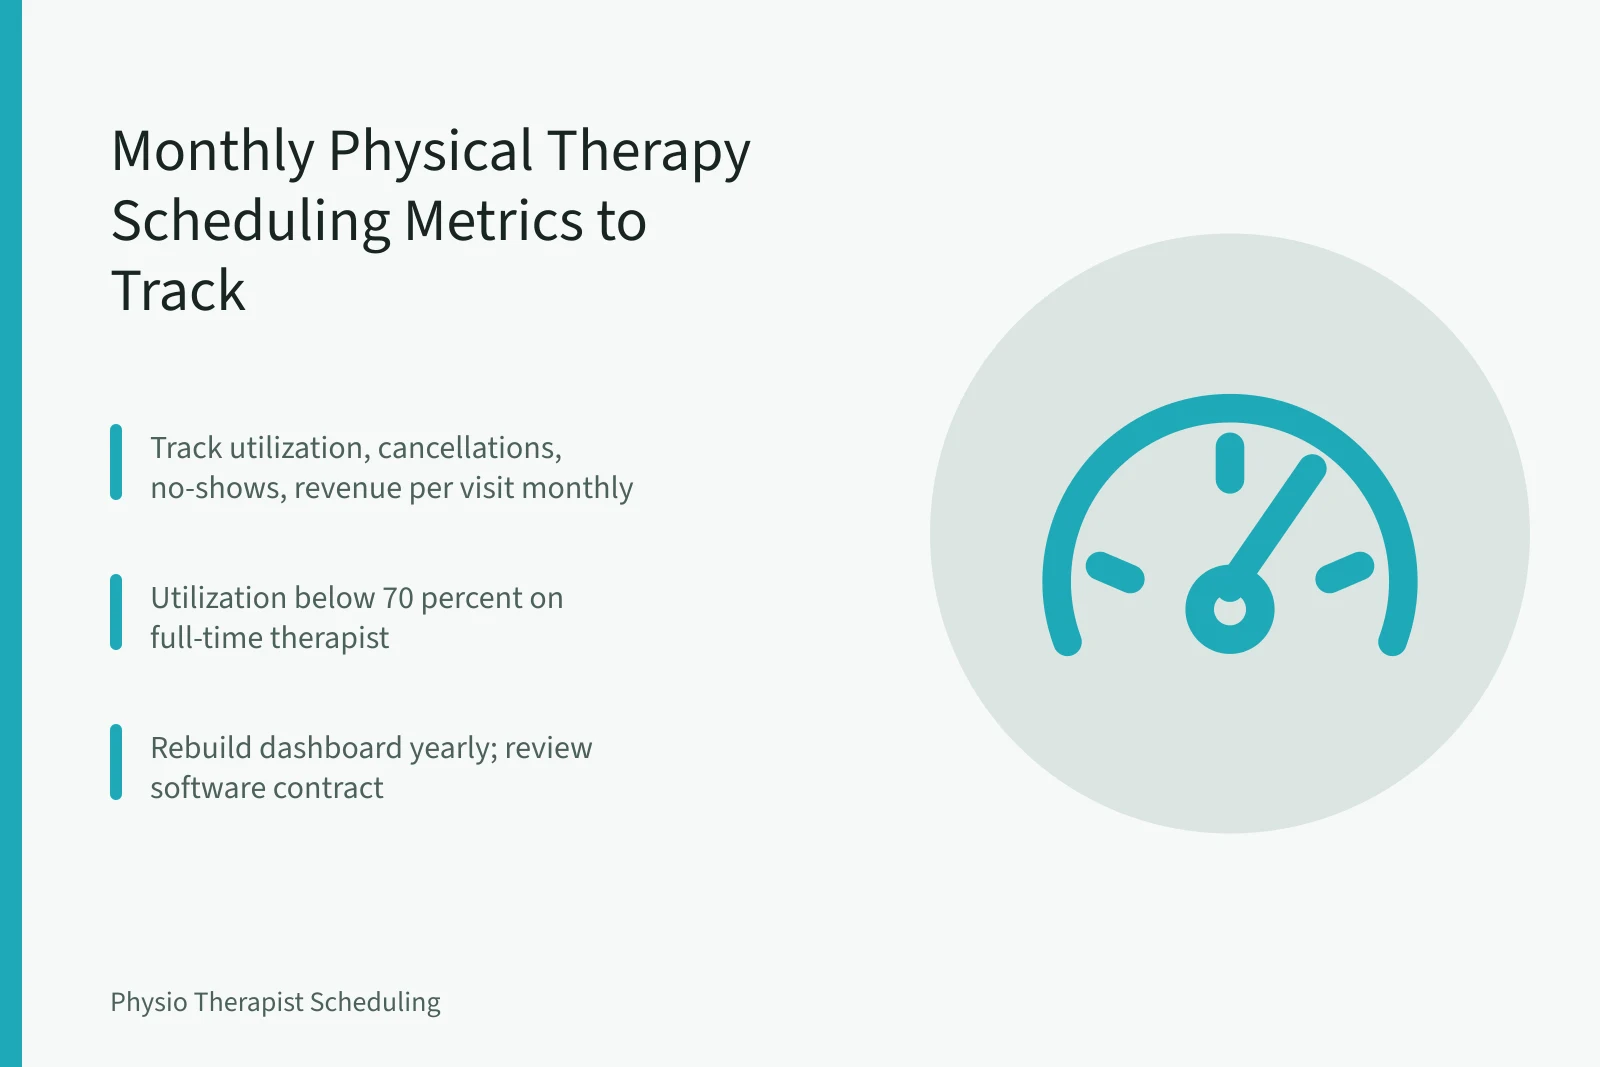
The dashboard is small on purpose. Pull these four numbers on the first business day of each month, from the same source every time, and write them in one row of a spreadsheet.
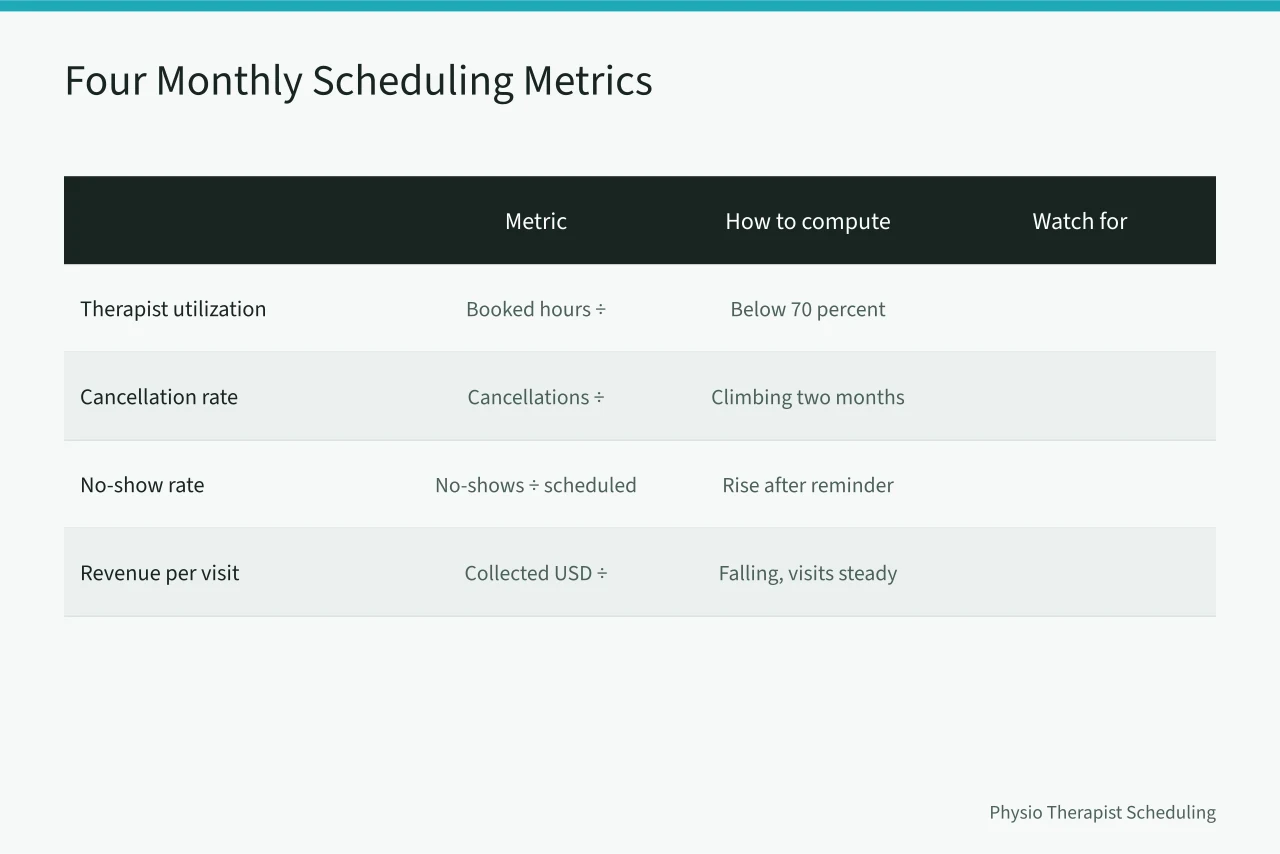
| Metric | How to compute it | Watch for |
|---|---|---|
| Therapist utilization | Booked treatment hours divided by scheduled clinical hours | Below roughly 70 percent on a full-time therapist |
| Cancellation rate | Cancellations divided by total scheduled visits | Climbing two months in a row |
| No-show rate | No-shows divided by total scheduled visits | Any rise after a reminder change |
| Revenue per visit | Collected USD divided by completed visits | Falling while visits hold steady |
Utilization is the load-bearing metric. A therapist scheduled 40 hours but treating 26 has a utilization rate near 65 percent. That gap is usually documentation, room turnover or a front desk that books too loosely. Compare your rate to your own payer mix rather than a national figure, because Medicare and commercial patients arrive through different referral paths with different cancellation habits.
Revenue per visit catches what the other three miss. If visits are steady and utilization is healthy but collected dollars per visit fall, the leak is in authorization tracking, visit caps or billing edits, not in the calendar. The Medicare scheduling rules explain how visit limits and certification periods change what you can bill, which is why this number moves without any change in booking behavior.
A metric you cannot compute in ten minutes is a metric you will stop computing by March.
After the first month
Once you have one clean month, compare it to the month before and to the same month last year. Seasonal patterns in physical therapy are real: January brings new deductibles and new referrals, while late summer often softens.
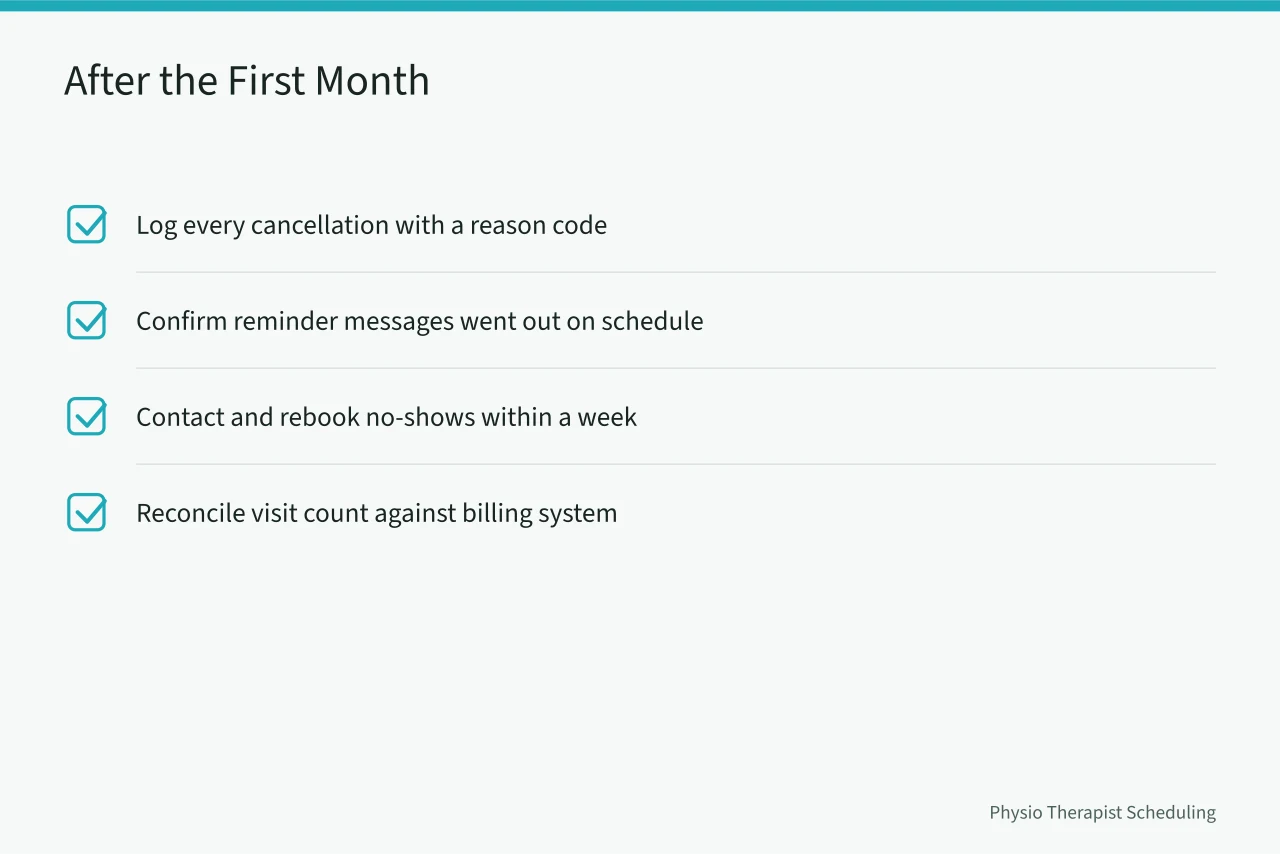
- Confirm the front desk logs every cancellation with a reason code.
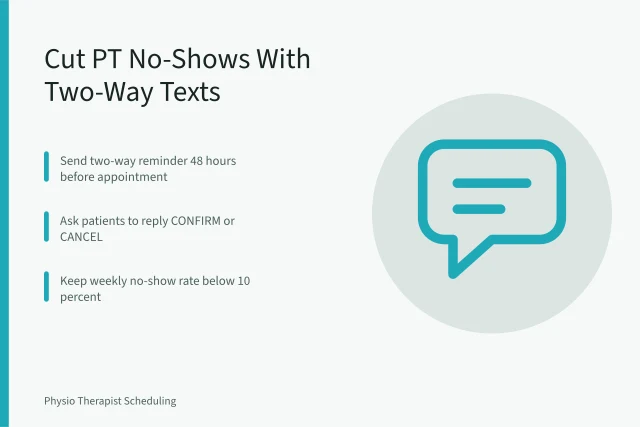
- Check that reminder messages went out on the schedule you set.
- Verify that no-show patients were contacted and rebooked within a week.
- Reconcile the visit count against the billing system.
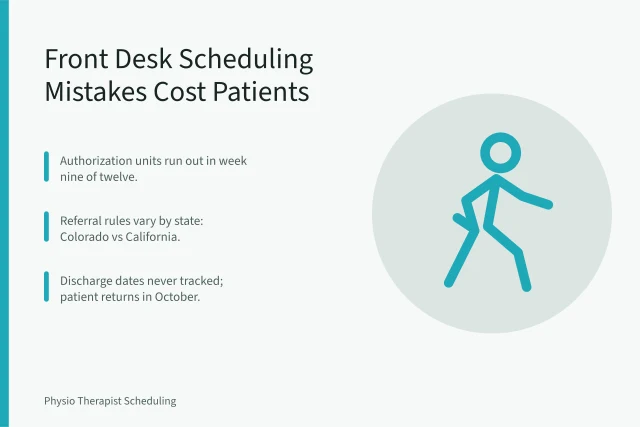
If you cannot answer why a cancellation happened, the reason codes are not being used. Fix that before adding any new metric. The front desk scheduling mistakes that cost you patients usually start as unlogged cancellations, which then look like random no-shows in the data.
Each season
Quarterly, look at the shape of the schedule rather than the totals. Blocked slots, half-empty mornings and double-booked afternoons all show up here.
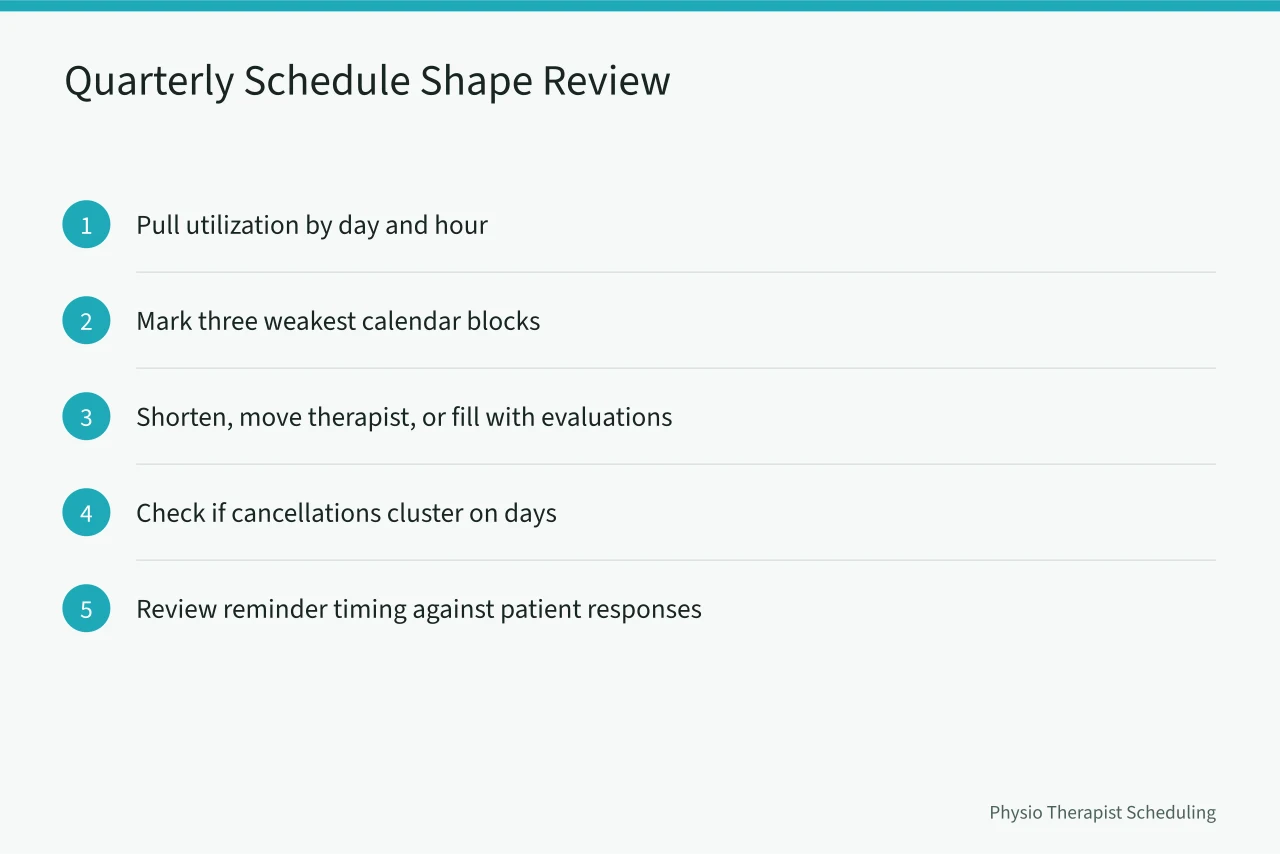
- Pull utilization by day of week and hour of day.
- Mark the three weakest blocks on the calendar.
- Decide whether to shorten those blocks, move a therapist, or fill them with evaluations.
- Check whether cancellations cluster on specific days.
- Review whether reminder timing matches when your patients actually respond.
Snowbird markets in Arizona and Florida need a separate seasonal read, since patient populations shift with the calendar. The snowbird season scheduling guide covers how to plan capacity around that migration without overstaffing the off months.
Once a year
Annually, rebuild the dashboard instead of just reading it. Ask whether each metric still drives a decision. Drop any that does not.
Review your no-show policy against state and payer rules, since a policy that works in one state may conflict with insurance requirements in another. The New York no-show policy guide shows how insurance rules constrain what you can charge, and the same logic applies in most states.
Also review staff scheduling obligations. The Department of Labor publishes FMLA guidance that affects how you cover a therapist on leave, and coverage gaps distort utilization for a full quarter if you do not plan for them.
Every few years
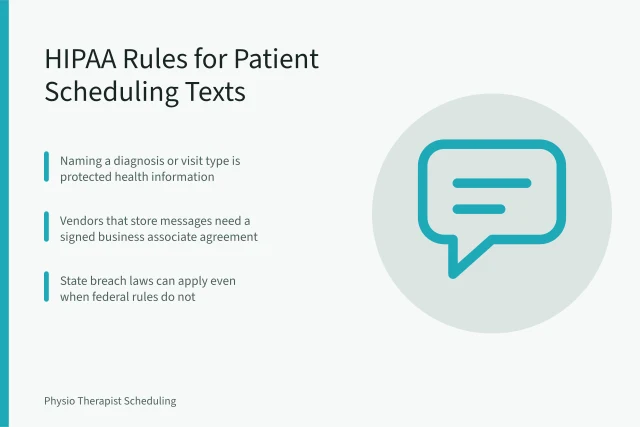
Software contracts, payer mixes and referral patterns change slowly, so revisit them on a multi-year cycle. When you do, compare at least five tools on the same criteria: reminder automation, waitlist handling, reporting depth, HIPAA safeguards and price per provider. A comparison of five scheduling tools gives you a starting point, and the HIPAA-compliant software guide covers the privacy questions to ask before signing. The HHS Privacy Rule sets the baseline for how reminders and confirmations may be sent.
Signs it needs attention now
Symptoms map to causes, and most of them point back to the reminder and confirmation step.
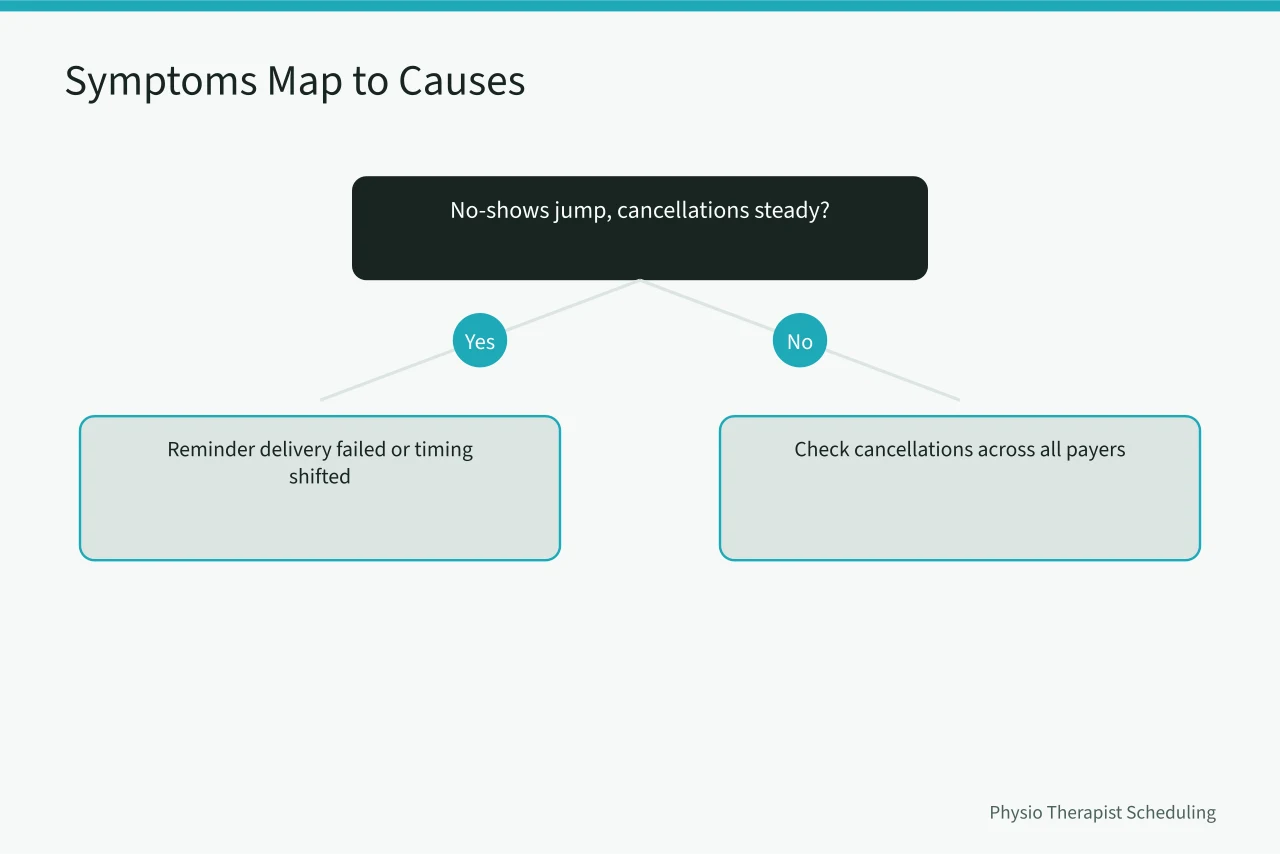
- No-shows jump while cancellations hold steady: reminder delivery failed or timing shifted.
- Cancellations rise across all payers at once: a policy change, not a patient change.
- Utilization falls but visits hold: documentation or room turnover is eating clinical time.
- Revenue per visit falls while visits hold: authorization or billing edits, not scheduling.
- One therapist's utilization lags the rest: template or panel size, not effort.
The first thing to fail from neglect is confirmation. Reminders get turned off during a software update, or a staff member stops calling the next day's list, and nobody notices for weeks because the schedule still looks full on paper.
Common questions
What is a reasonable PT no-show rate?
Most independent clinics run in the single digits to low teens as a percentage of scheduled visits. Treat any figure as illustrative until you have your own twelve-month baseline, because payer mix and reminder practice move it more than geography does.
Should I compare utilization to a national benchmark?
No. Compare to your own history and to clinics with a similar payer mix. Medicare, Medicaid and commercial patients arrive through different referral paths and cancel at different rates, so a national average hides more than it shows.
How often should the dashboard change?
Once a year is enough. Add a metric only when it answers a question you already have, and remove one when it stops changing a decision.
What if revenue per visit drops but visits are steady?
Look at authorizations, visit caps and billing edits before you touch the schedule. The calendar is usually the last place the problem lives.